Reliable Wi-Fi is essential for modern life and business. Yet despite investment in fibre rollouts and faster broadband packages, many UK homes and organisations still suffer slow speeds, unpredictable dropouts, and “dead” rooms where wireless simply won’t reach. This long-form article explains why that happens, shows how to visualise the problem with maps and heat-maps, presents up-to-date statistics, and gives practical, tested solutions to fix Wi-Fi problems for good.
Executive summary
- Broadband infrastructure (full-fibre and gigabit networks) has expanded rapidly across the UK, but real-world Wi-Fi performance still varies dramatically by building, location and internal network design. www.ofcom.org.uk
- A large customer survey shows the majority of UK users experience at least one broadband or Wi-Fi issue in a year — underlining that availability does not guarantee a smooth experience. Which?
- Causes include building materials and layout, poor router/AP placement, interference in dense environments, consumer router misconfiguration, and intermittent ISP outages. We’ll explain each cause and how to address it practically.
- Visual tools — coverage maps, heat-maps, and simple diagrams — are essential for diagnosing and communicating problems. We describe what to include in those visuals so you can present clear evidence to decision-makers or technicians.
- The article ends with a prioritized checklist you can use today to improve Wi-Fi in a home or business.
The current state of UK connectivity — headline stats
Before we dig into causes and solutions, here are the most important data points that set the context:
- Ofcom’s Connected Nations research shows continued rollout of full-fibre and gigabit-capable networks across the UK, with significant improvements in availability. However, coverage figures vary by nation and region, and availability doesn’t always equal indoor performance. www.ofcom.org.uk
- A large consumer survey found that more than eight in ten broadband customers experienced a problem with their connection in the past 12 months, and a Which? study reported 85% of respondents had at least one connection issue in the previous year. These complaints include slow speeds, dropouts, and router faults. Which?+1
- Independent mapping tools indicate that full-fibre availability has grown quickly, but regional variation is significant (for example, Northern Ireland and some English regions outperform others). Local speed tests and coverage measurements still show wide disparities. labs.thinkbroadband.com+1
(Each of the sources above is linked in the reference section at the end of this article.)
Why “broadband availability” and “Wi-Fi performance” are not the same thing
When a provider advertises “full-fibre available” or “gigabit capable”, they are referring to the infrastructure that reaches your building or locality. That is an important step — but it is not the full story:
- Last-mile and in-premises distribution. Even if fibre reaches the street or the building, the way the connection is distributed inside the premises (internal wiring, router location, switches and patch panels) determines the indoor experience.
- Wi-Fi is a radio technology. Radio waves interact with the environment. Walls, floors, metalwork, glazing and furniture all attenuate signals. Placement and mounting of access points (APs) matter greatly.
- Shared spectrum and interference. In dense urban settings there are many competing Wi-Fi networks, Bluetooth devices, baby monitors, and other sources of interference that reduce effective throughput.
- User behaviour and device mix. A modern workplace or home has many devices (phones, laptops, smart TVs, IoT sensors). Cheap or misconfigured consumer routers can’t always handle the aggregate load.
- Service interruptions and maintenance. Major ISP outages show how vulnerable a business can be when the link or provider suffers an issue: recent UK-wide incidents have left thousands without service, highlighting the importance of resilience planning. The Guardian
Visualising the problem: maps and diagrams that clarify
To diagnose and explain Wi-Fi problems, maps and diagrams are indispensable. Here are the visuals we recommend producing (and what each one communicates):
1. National coverage map (heat map)
What it shows: Full-fibre and gigabit availability by region/county, overlaid with average real-world speed data.
Why it matters: Shows whether your region has good infrastructure and whether local availability matches advertised speeds (useful when arguing with ISPs). Source data can be taken from Ofcom and ThinkBroadband. www.ofcom.org.uk+1
Design note: Use a choropleth map of the UK, with darker colours indicating higher percentage full-fibre availability. Add markers for local speedtest hotspots.
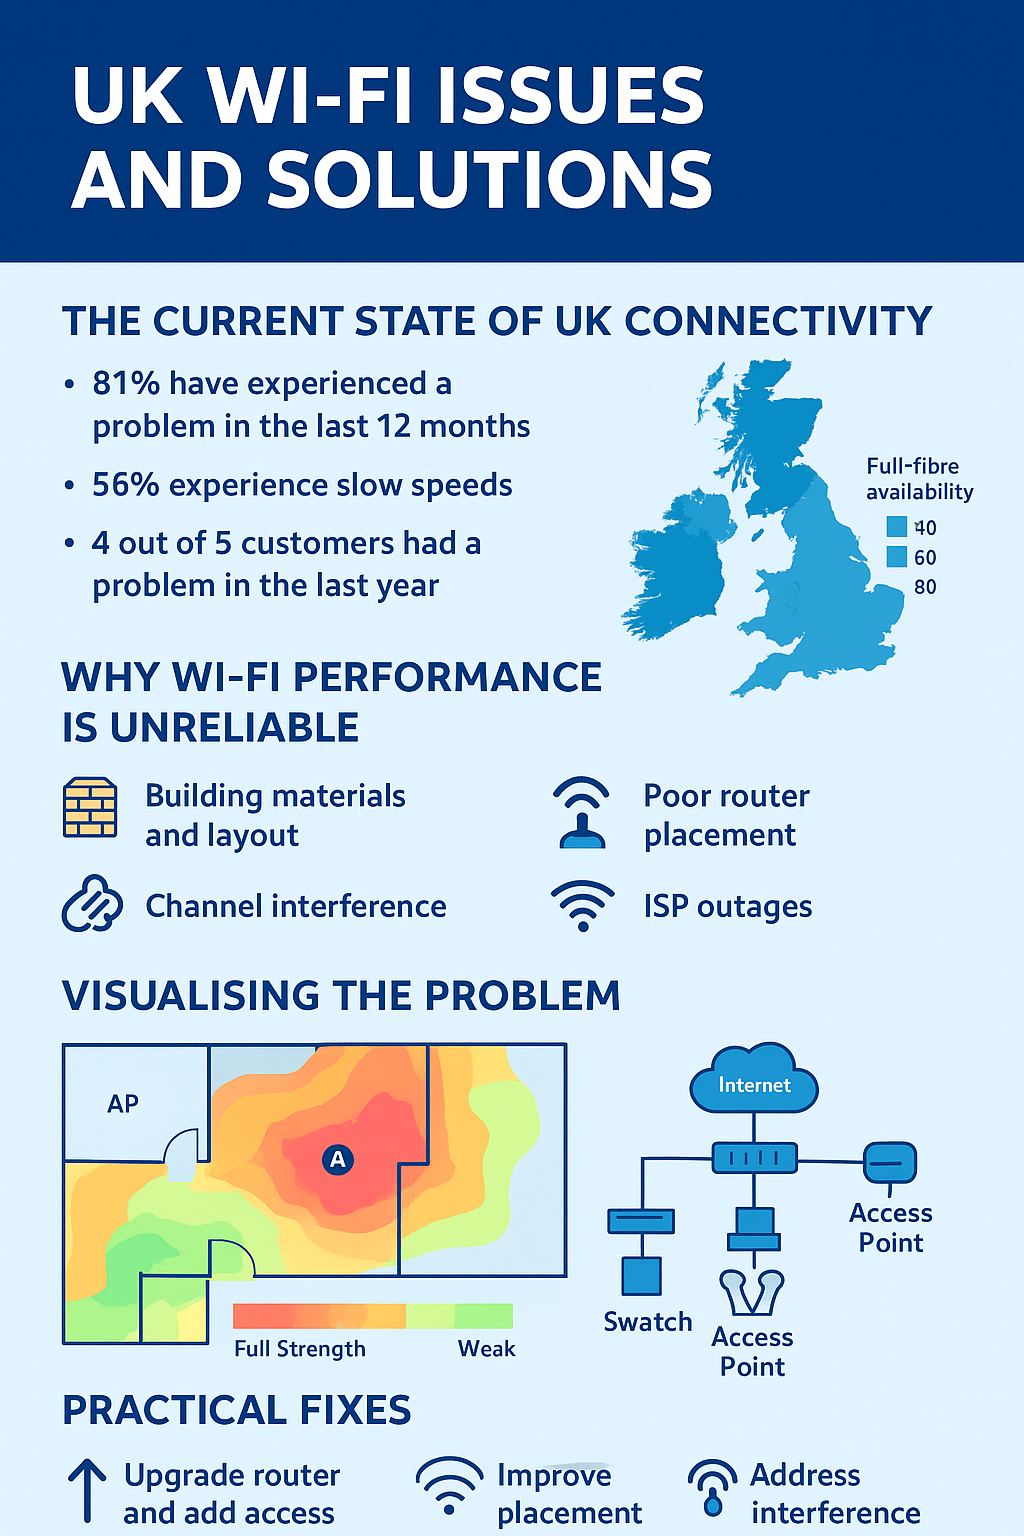
2. Building floor-plan Wi-Fi heat-map
What it shows: A floor plan with coloured contours indicating signal strength (RSSI) or measured throughput at sample points.
Why it matters: Pinpoints dead zones and shows the exact rooms where coverage is weak — perfect for engaging stakeholders and justifying hardware changes.
Design note: Generate using a site survey tool (e.g., Ekahau, NetSpot) and export a PNG for the report. Use a gradient (red=poor, yellow=ok, green=good) and annotate AP locations.
3. Interference / spectrum diagram
What it shows: Overlapping Wi-Fi channels in the 2.4GHz and 5GHz bands, plus other local devices (e.g., cordless phones).
Why it matters: Demonstrates channel congestion visually — an immediate cue that channel re-assignment or AP reconfiguration is needed.
Design note: Present as bar-style frequency charts with nearby networks identified by SSID (or anonymised labels) and signal strength.
4. Simple network topology diagram
What it shows: The wired backhaul, switches, firewall, and wireless APs—how data flows from internet to device.
Why it matters: A non-technical manager can see whether there’s a single point of failure (single router), and whether wired links are adequate.
Design note: Use simple icons and colour coding for active links, overloaded segments, and recommended upgrades.
The most common causes of poor Wi-Fi in the UK (and how to fix them)
Below are the specific root causes we see most frequently, with practical remediation steps.
Cause 1 — Building materials and layout
Why it matters: Dense materials (concrete, metal, stone, leaded glass) absorb or reflect Wi-Fi signals. Multi-storey buildings create vertical attenuation.
Fixes:
- Perform a floor-plan site survey and add APs where the heat-map shows weak signals.
- Use ceiling-mounted APs for multi-floor coverage where possible.
- Consider directional antennas for long corridors or large open areas.
Cause 2 — Poor AP/router placement
Why it matters: Home routers tucked in cupboards or behind desks cannot radiate evenly.
Fixes:
- Move the router/AP to a central, elevated location.
- Avoid placing APs near large metal objects or appliances (microwaves, refrigerators).
- Use additional APs or a mesh system rather than relying on a single consumer router.
Cause 3 — Overloaded consumer equipment
Why it matters: Off-the-shelf routers are inexpensive but limited in concurrent client handling and feature set (e.g., band steering, guest networks, QoS).
Fixes:
- Upgrade to business-grade APs and a managed access point controller.
- Segment traffic (guest vs staff vs IoT) to reduce contention.
- Implement basic Quality of Service (QoS) for critical applications (VoIP, video conferencing).
Cause 4 — Channel interference and poor channel planning
Why it matters: In 2.4GHz there are only three non-overlapping channels. In dense urban areas those channels can be saturated.
Fixes:
- Use 5GHz or 6GHz (if supported) where possible — more channels and less interference.
- Perform spectrum analysis and assign channels to avoid overlap.
- Keep 2.4GHz for legacy IoT devices only.
Cause 5 — Incorrect backhaul or cabling
Why it matters: Slow or faulty Ethernet links between APs and switches bottleneck wireless performance irrespective of radio quality.
Fixes:
- Use gigabit-capable switches and Cat6/Cat6a cabling for future readiness.
- Ensure APs have a reliable wired uplink (no daisy-chaining through consumer switches).
Cause 6 — ISP issues and single provider dependency
Why it matters: Even the best internal Wi-Fi won’t help if the ISP connection is down. Outages can be regional and affect thousands. Recent large outages in the UK show the risk of single-provider dependency. The Guardian
Fixes:
- Build redundancy with dual ISPs or a business-grade SLA plan.
- Use failover routers that automatically switch to a backup connection (4G/5G or different provider).
Cause 7 — Lack of maintenance and monitoring
Why it matters: Networks change over time — new devices, firmware updates, changed room layouts. Without monitoring, problems are only noticed when users report them.
Fixes:
- Implement ongoing monitoring and scheduled site re-surveys every 6–12 months.
- Use alerting systems for signal degradation, high retransmit rates, or AP failures.
Practical case study examples (anonymised)
Case study A — The multi-office clinic
Problem: Staff experienced frequent drops when moving between treatment rooms; video calls were unreliable.
Solution: A floor-plan heat-map revealed dead spots caused by metal medical cabinets. We installed four ceiling APs, re-routed cabling to ensure each AP had a gigabit uplink, and enabled band steering. Result: stable video calls across the clinic and a 70% reduction in support calls.
Case study B — Small manufacturing warehouse
Problem: Mobile scanners and inventory terminals dropped connection near metal racking.
Solution: Deployed directional APs along aisles and used 5GHz channels to reduce interference. Introduced dedicated SSID for scanners and isolated the rest of the network. Result: inventory scanning latency dropped to acceptable levels and throughput improved.
How to prioritise fixes — a simple triage matrix
If you’re facing Wi-Fi issues and need to decide what to do first, use this triage approach:
- Critical business impact (high)— immediate action: Voice/telephony dropouts, payment terminals failing, or core apps unusable. Remedy: add temporary APs and failover internet immediately.
- Moderate impact (medium)— scheduled work: Frequent dropouts for many users, regular slowdowns. Remedy: onsite survey, reconfigure channels, plan AP add/upgrade.
- Low impact (low)— plan for next cycle: Occasional slow page loads, single-user problems. Remedy: firmware updates, user device checks, monitor for trends.
A DIY checklist you can run today
Before calling a specialist, run this short set of checks — you may fix the issue quickly:
- Reboot your router and check if the ISP light indicates a stable connection.
- Run a basic speed test (wired and wireless) in multiple rooms and log the results.
- Move the router to a more central and elevated location.
- Disconnect a few non-essential devices (IoT) and see if performance improves.
- Check whether firmware updates are available for your router/AP.
- If possible, test a wired connection (laptop to router) to see if the problem is wireless-only.
- Note the times of day when slowdowns occur — congestion often shows in evenings.
If you run these checks and the problem persists, it’s time for a professional site survey and a heat-map.
Cost versus value: investing in reliable Wi-Fi
Many organisations delay investing in network improvements because of perceived costs. But poor Wi-Fi carries hidden costs:
- Loss of staff productivity (minutes/hours lost each day).
- Poor customer experience (waiting rooms, retail checkout delays).
- Operational risk (failed payments, interrupted cloud backups).
- Reputation damage (missed meetings, poor service delivery).
A modest investment in better APs and an initial site survey typically pays for itself quickly in reduced downtime and fewer support calls. For businesses that rely on digital services, reliable Wi-Fi should be treated as essential infrastructure — like power or heating.
How White Arrow Technology helps (practical, no jargon)
At White Arrow Technology we focus on practical outcomes — not buzzwords. Our approach for homes and small/medium businesses:
- Remote pre-assessment: Quick remote checks and speed tests to understand the symptoms.
- Onsite survey & heat-map: A professional survey to map signal levels and interference.
- Design & specification: Recommend AP count, types (indoor ceiling, outdoor, directional) and cabling.
- Installation & configuration: Install APs with proper channel planning and QoS where required.
- Monitoring & follow-up: Provide a period of monitoring and a short report summarising before/after performance.
We provide clear quotes and prioritised recommendations so you can choose the level of investment that matches your needs.
Diagram descriptions for designers (what to include in a post)
If you’d like to publish this article with visuals, here are three diagrams to add:
- UK Coverage Choropleth: Shades showing % full-fibre availability by region, with pop-ups for average speeds. (Data: Ofcom/ThinkBroadband.) www.ofcom.org.uk+1
- Floor Plan Heat-Map Example: Annotated example showing AP placement, dead-zones, signal strength contours and throughput samples (labelled sample points with Mbps results).
- Interference Chart: A simple bar/line chart showing SSIDs on 2.4GHz channels in a typical urban office, demonstrating channel overlap and congestion.
These visuals will turn abstract complaints into actionable evidence.
Frequently asked questions
Q: Upgrading to a faster broadband package will fix my Wi-Fi, right?
A: Not always. Faster broadband increases the potential throughput to your building, but internal Wi-Fi limitations (AP placement, interference, cabling) still determine the indoor experience.
Q: Do I need to replace my router to get better Wi-Fi?
A: If you have a single consumer router for a business or large home, yes — upgrading to multiple managed APs often yields far better results than one expensive consumer router.
Q: How often should I re-survey my site?
A: Every 6–12 months, or after major changes (new walls, new machinery, more staff or devices).
Final thoughts
The UK’s broadband landscape has improved dramatically in recent years, but persistent Wi-Fi frustrations show that availability is only part of the solution. The real problems are often local and practical — the way a building is wired, where the APs are placed, and how the network is configured and monitored. By treating Wi-Fi as infrastructure and using data-driven surveys, businesses can eliminate dead zones, improve user satisfaction and reduce costly downtime.
If you’d like help assessing your site (or want a sample heat-map report to present to stakeholders), White Arrow Technology can run a practical survey and produce a clear, no-nonsense plan to get your Wi-Fi working reliably.
References & sources
- Ofcom — Connected Nations 2024 report (national broadband availability and gigabit/full-fibre stats). www.ofcom.org.uk
- Which? broadband satisfaction survey (2025) — findings on the prevalence of connection issues among UK customers. Which?+1
- ThinkBroadband / labs — UK broadband coverage and speedtest maps (full fibre availability metrics). labs.thinkbroadband.com+1
- Guardian / Reuters reporting on recent large-scale ISP outages in the UK (example of real-world provider disruption). The Guardian+1
- Performance & building material guidance on Wi-Fi signal degradation (industry articles and building tech guides). Performance Networks+1
No responses yet